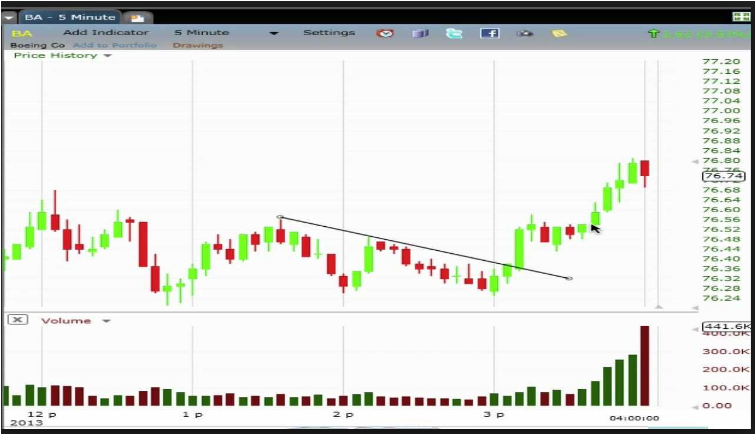
Pattern identification starts with identifying the 1-2-3 movement of the price action on the charts. The daily chart provides room for such analysis, though the 4-hr chart can also be used as a substitute. These charts are used for trend identification. True market reversals are predicted from the true trend. Smaller time frame charts do not show the true trend as they only reflect intraday market movements.
Click Here to Download A NEW Trading Tool and Strategy For FREE
Once the trend is identified, the next step is to identify the 1-2-3 pattern when it occurs. The “1-2-3” sequence is the move the price action makes prior to the reversal. The price action moves in the trend and either tops out or bottoms out at point 1, moves in the opposite direction as a retracement to point 2, then moves back in the initial trend direction to a point 3 which represents a Fibonacci retracement level of a line 1-2, then the price action moves in the reversal mode from point 3, taking out a key level of support or resistance formed by point 2 in its path.

So identification of the 1-2-3 reversal setup requires an understanding of these points:
You need a trend line tool to draw the line from point 1 to 2.
You need the Fibonacci retracement tool to identify the 38.2% or 50% retracement of a line drawn from point 1 to 2, which is lower than point 1 in an uptrend and higher than point 1 in a downtrend.
The retracement level is point 3.
Understanding the extent of retracement will therefore aid the trader as to where the entry for the reversal trades will be made.”